July was officially my second month on the new website. And I am thrilled to have published over 20 articles. My key focus in July was:
- Web Development (9 articles): I spent most part of the month exploring and learning various web development technologies. I curated online tutorials and wrote a brief overview of these technologies on my blog.
- Goal Getting (6 articles): I started writing about setting goals as part of this new series on my website.
But in July, I also introduced a few other topics like Philately and 100+ Happy Days.
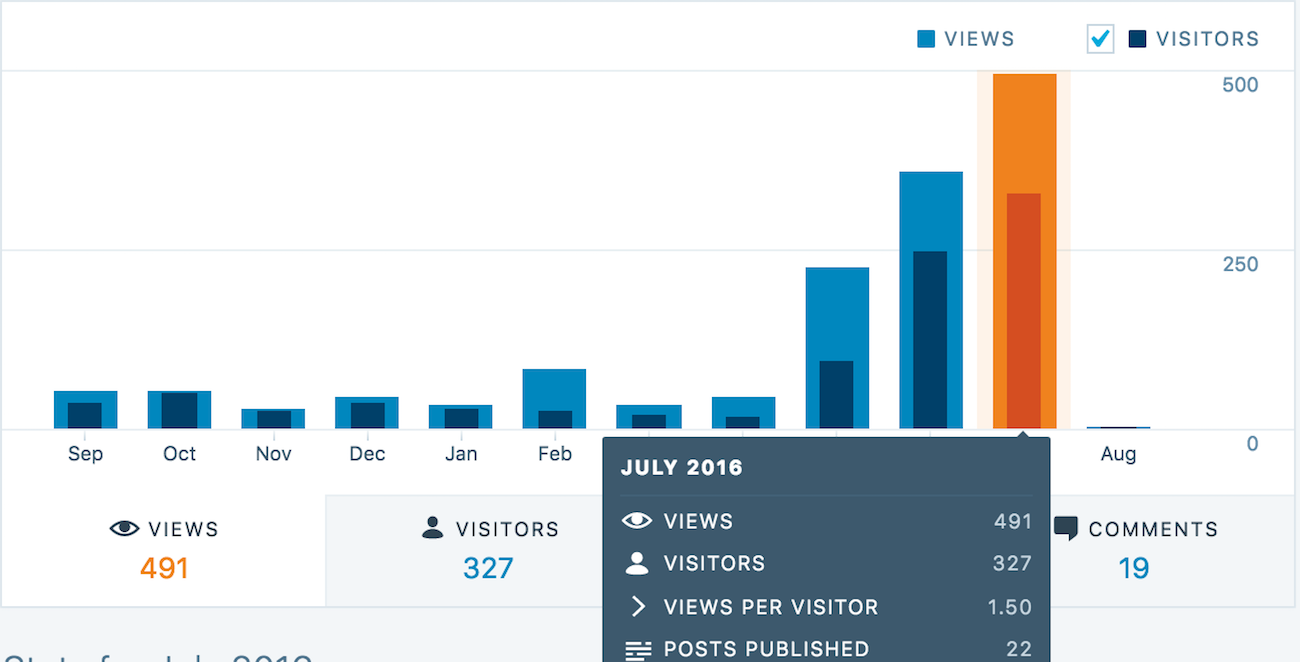
How Many Views in July?
Last month, I was 54 visitors short of my goal. But this month my website had 327 visitors with 491 views. Yes… 27 visitors ahead of my goal! I owe it to a lot of you for sharing my website both verbally and on your social networking sites. Thank you! 🙂
What were my Most Visited Pages?
I have used Google Analytics to gather statistics about my website.
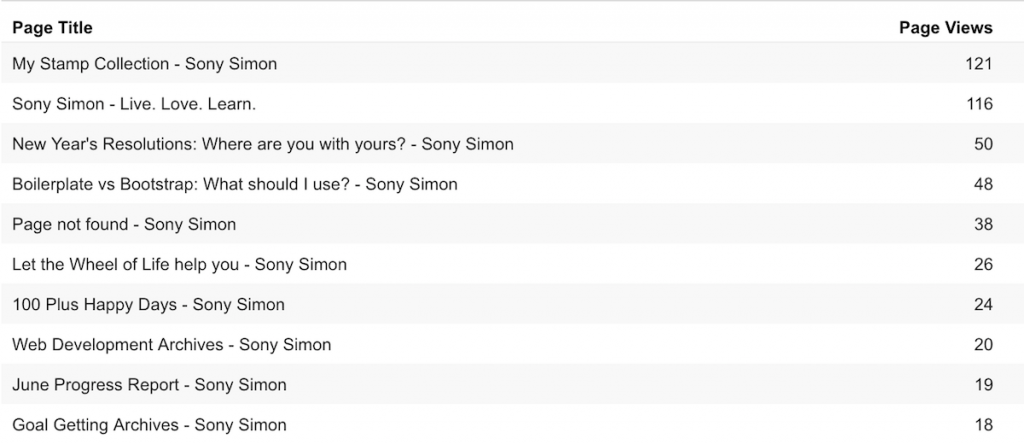
As you can see the 3 most visited pages were:
- My Stamp Collection posted on 24th July
- My Home Page (changed my website theme on 29th July)
- New Year’s Resolutions: Where are you with yours? posted on 5th July
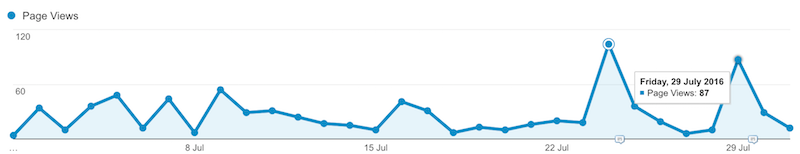
You can see that there are hikes in the page views on both 24th and 29th July. 29th July was when I changed my website theme to Sahifa. This month the “popularity” was definitely based on novelty.
a) In my article about my Stamp Collection, I posted a video of me. Having my photo up as the featured image helped too.
b) Sharing my website link after I did the theme change attracted a lot of curious visitors to my website.
Who are my Visitors?
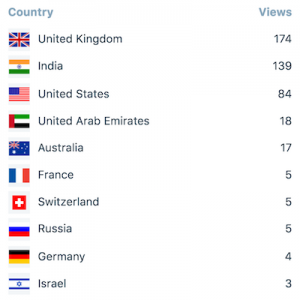
UK, India, USA and UAE still has the top 4 places. This month’s surprises were Russia and Israel at positions 8 and 10.
I had 12 comments on my posts, but I am guessing some of them were definitely spam. I still have a lot of shy visitors. Because I receive a lot of views and likes, but very few comments.
Based on Google Analytics, my website continues to maintain the returning visitors at around 68%. Thanks for the loyal following guys! 🙂
What are the Top Sources of Traffic to my Website?
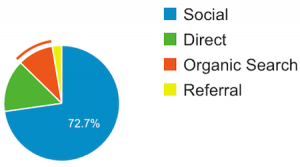
The top traffic source in July continues to be Social Media at 72.7%. I also learned that the referrals are a result of bots and spiders. I have made a couple of changes on Google Analytics today and will wait until the end of this month to find out more.
But this time, Search traffic was at 10% with 45 views. I am pleased with that, to be honest.
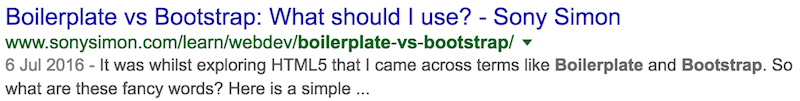
One of the articles I wrote about “Boilerplate vs Bootstrap” is now featured as the 15th Google Search Result. I only got to know about this, when someone from the internet contacted me to seek more advice on topic and I was totally chuffed! 🙂
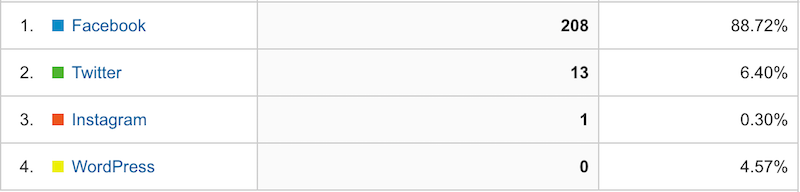
There were no surprises with my Social Media Traffic with Facebook bringing in 88% of the total traffic and Instagram bringing in the least at 0.30% (i.e. 1 user). But I decided to do something else this time. I looked at how many new users came in through each of my social media referrals and I was astounded to find that Facebook bought in 208 new visitors this month… wow… the power of sharing! 🙂
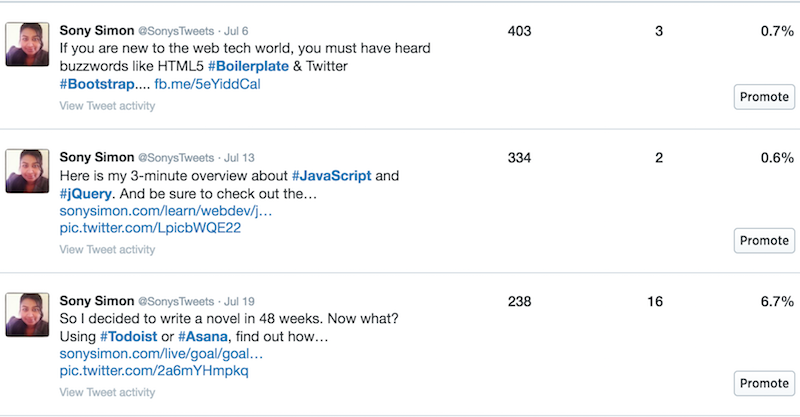
Twitter brought in very mild traffic with 21 views. My top 3 posts on Twitter were
- Boilerplate vs Bootstrap: What should I use? (I think Twitter may be the reason this article made it into the Google Search Results)
- JavaScript and jQuery
- Goal Setting and Getting using Todoist or Asana (This tweet brought in 8 visitors)
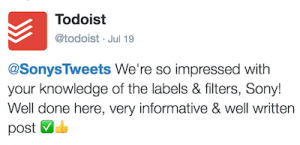
One of my moments of pride was when “Todoist”, a product I was writing about, responded to my tweet with a compliment. 🙂
Three Key Lessons from July
- Use my photos on my website (this is the second time this has happened and there is definitely a pattern)
- Videos attract more visitors
- Sunday is special! I see more visitors on Sunday than any other day.
What’s in store for August?
In August, I will be focussing on creating a Style Guide for my website. I intend to continue with my recent series about Goal Getting. I am unsure if I want to continue with the Philately videos. I received an underwhelming response for my article about Video: Stamps of India from my Stamp Collection. Let me know if you think I need to keep this topic in.
How else do you think I can improve my website?